Reporting tool
Create a HUME PDF report for your clients
To make your documentation and communication process easier, we introduce the report tool. It can be used to:
Generate a PDF report for your Electronic Client Portal.
Send to colleagues for faster communication.
Presented in HUME Evaluation meetings.
Be careful: Do not enter any personal data (e.g., names, social security numbers, client IDs, locations, or organisation names).
Step 1: Write a title and a research question.
You can edit the default title for your report from the upper left card. .gif?inst-v=174e8e58-dac9-4992-879c-00705ffc81b9) | |
You can write a description to inform about the main goal/content of this report from the upper left card. .gif?inst-v=174e8e58-dac9-4992-879c-00705ffc81b9) |
Step 2: Add charts to your report (max 20).
You can use every chart that already exists in MyHume to write your report.
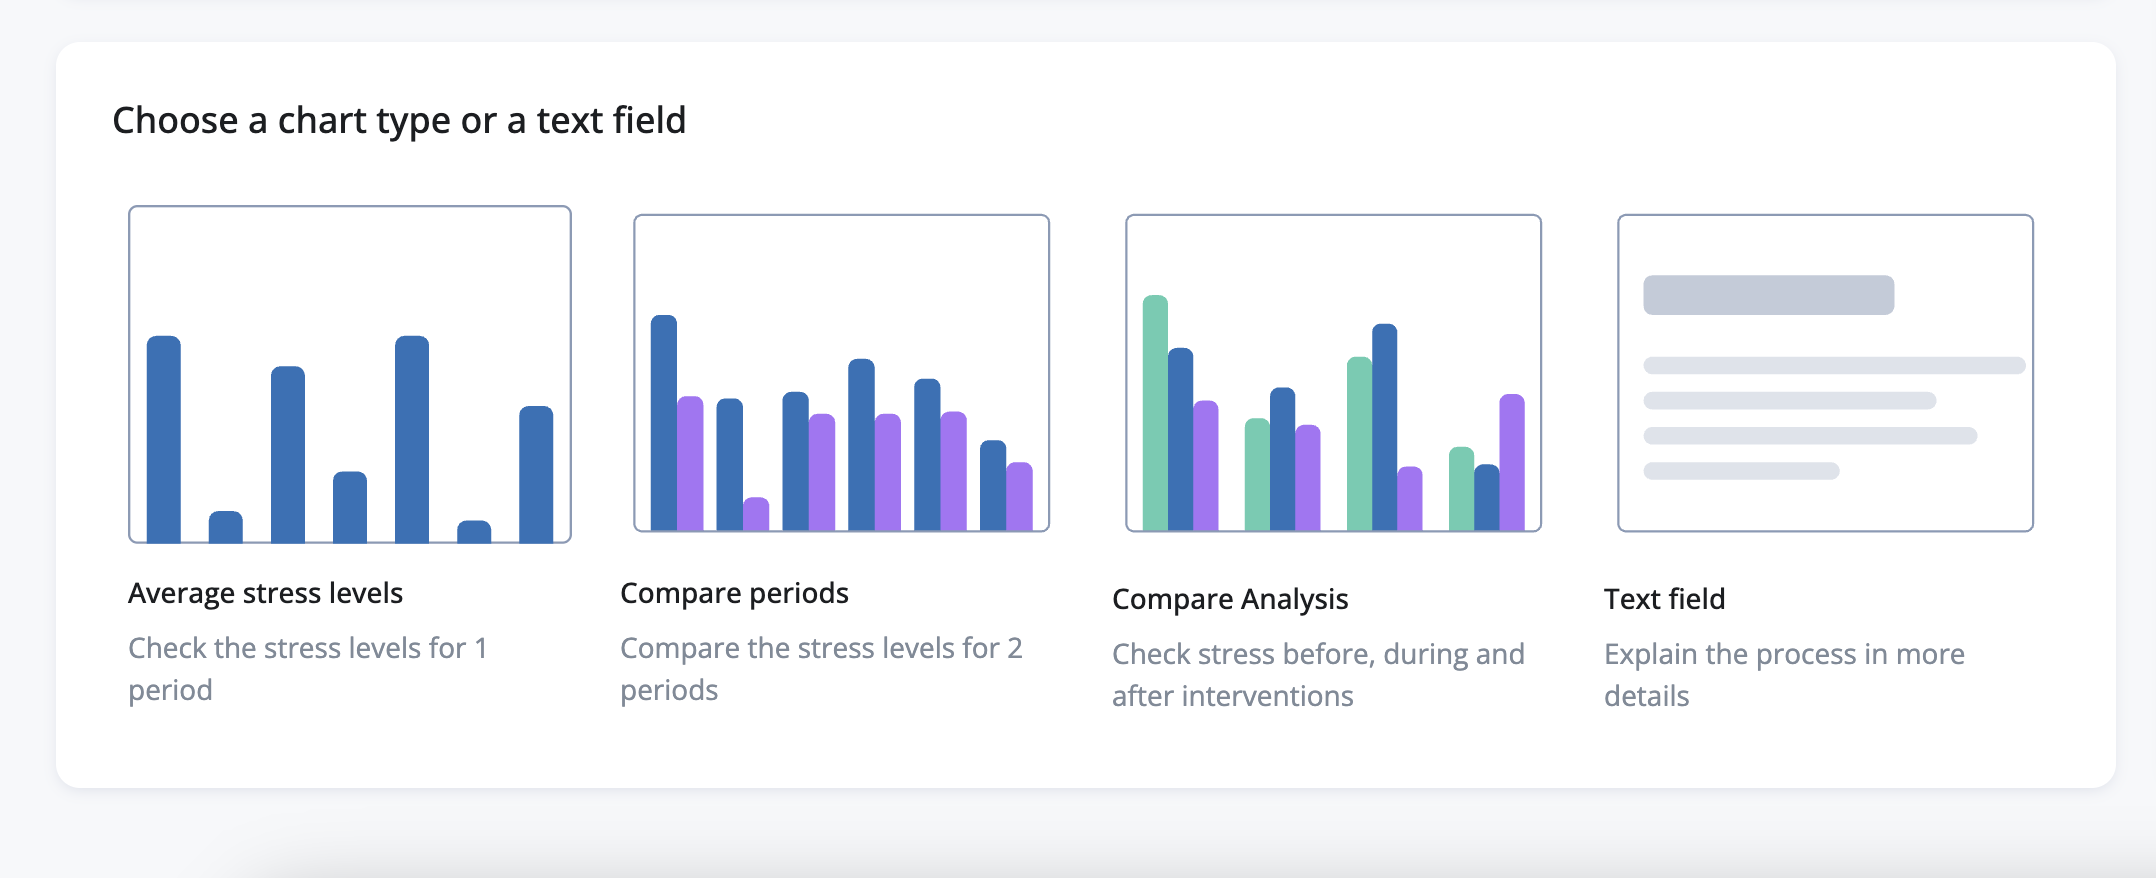
Select one of the 4 options:
 | |
Use the controls to show the data you want to input in the report. 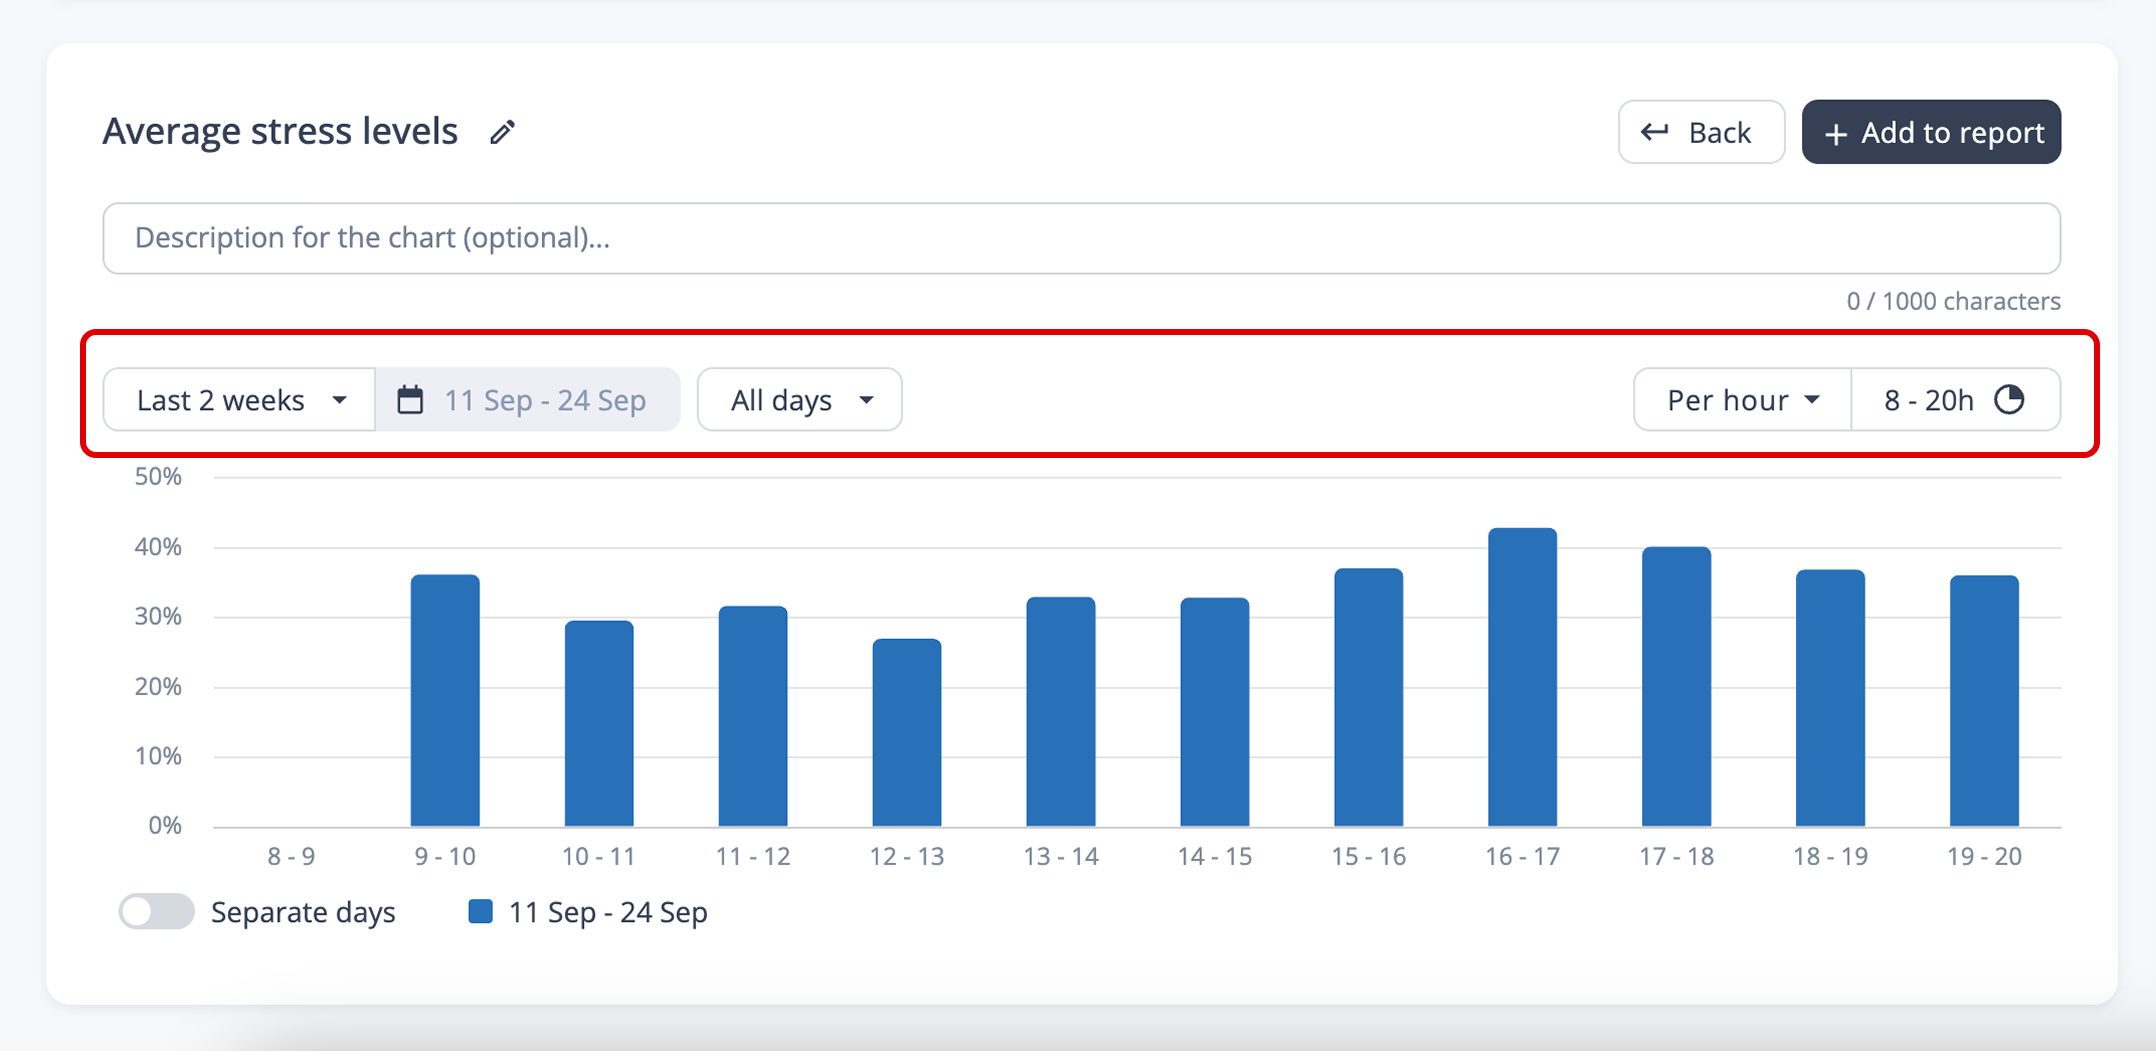 | |
3. | Optional: Put a description in the text field to add extra context to the chart in the report. 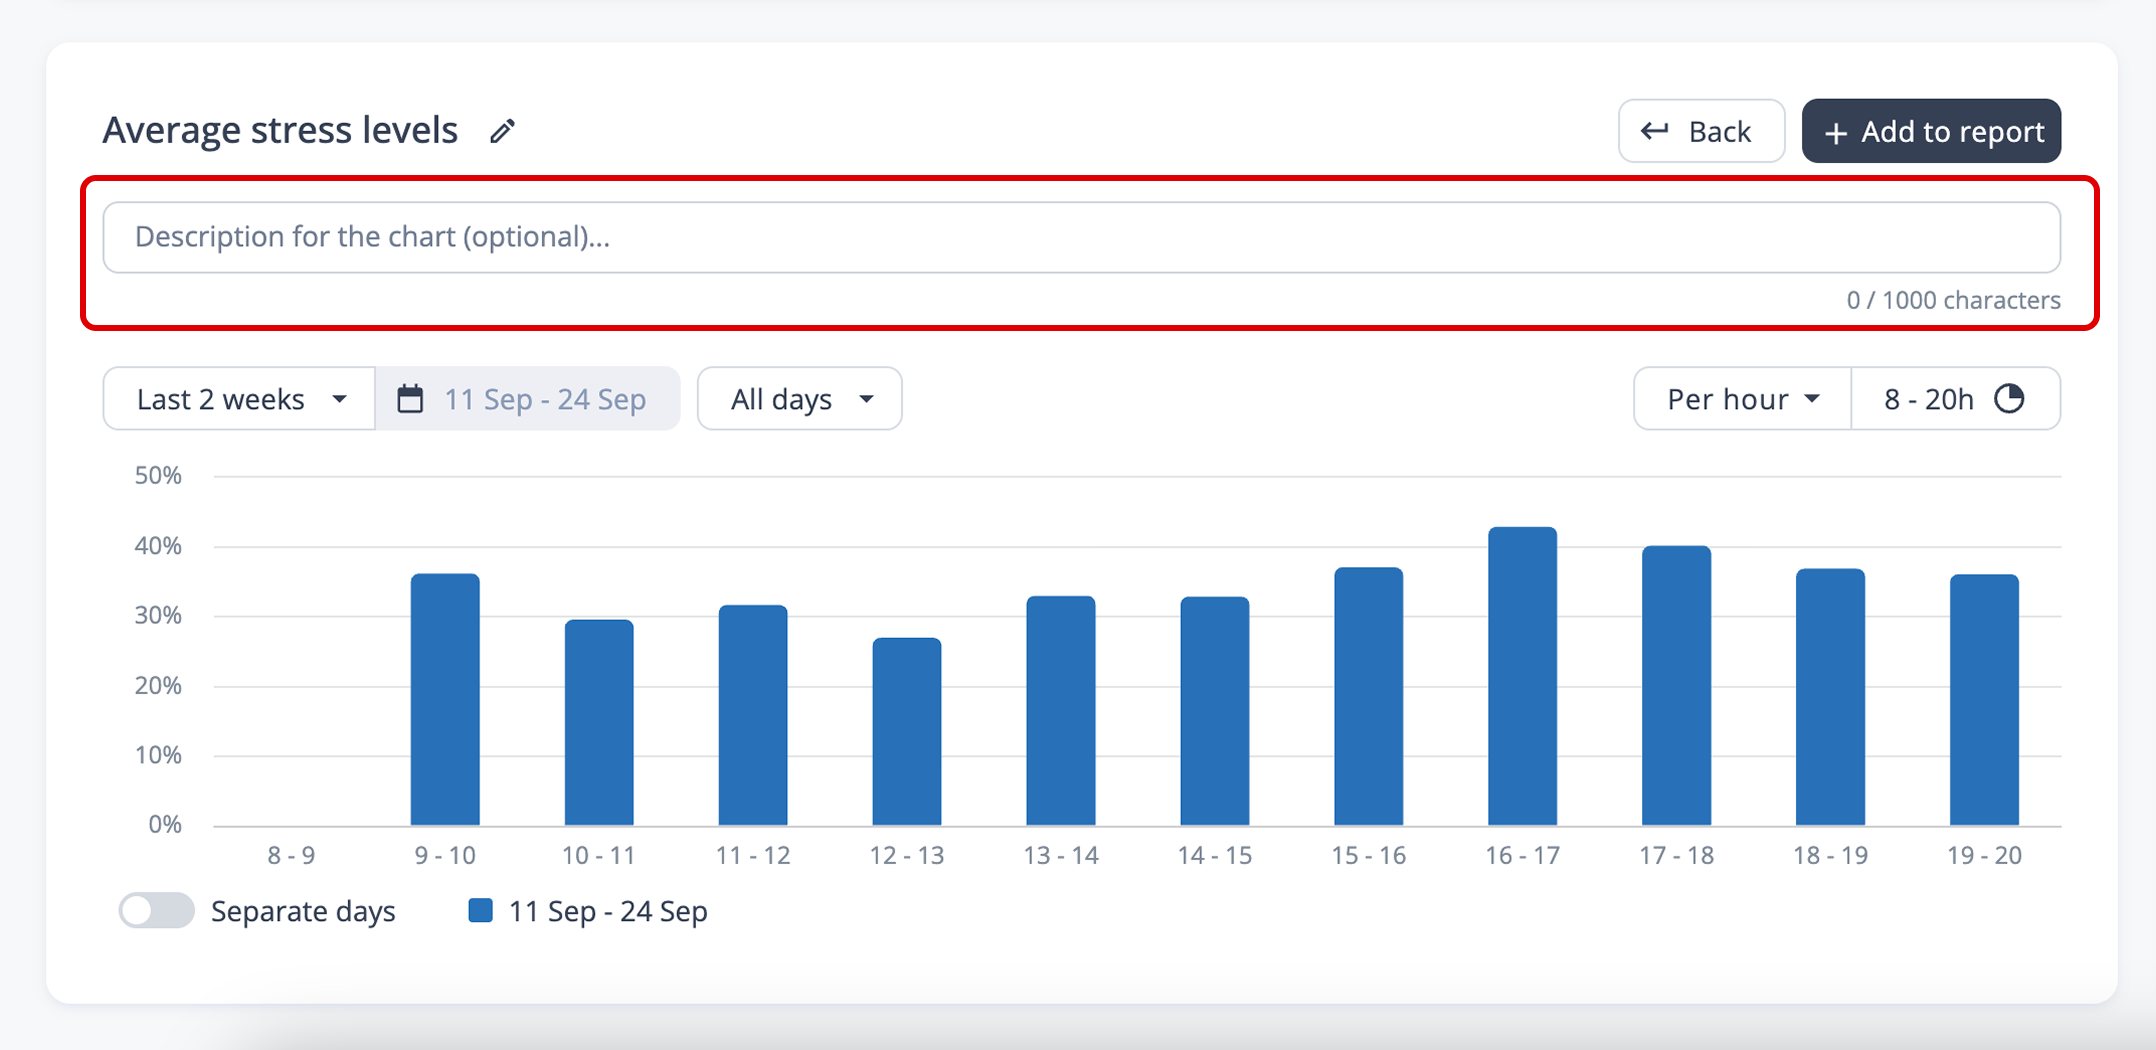 |
3.1 | Optional: Change the title so it better matches the content of the chart. 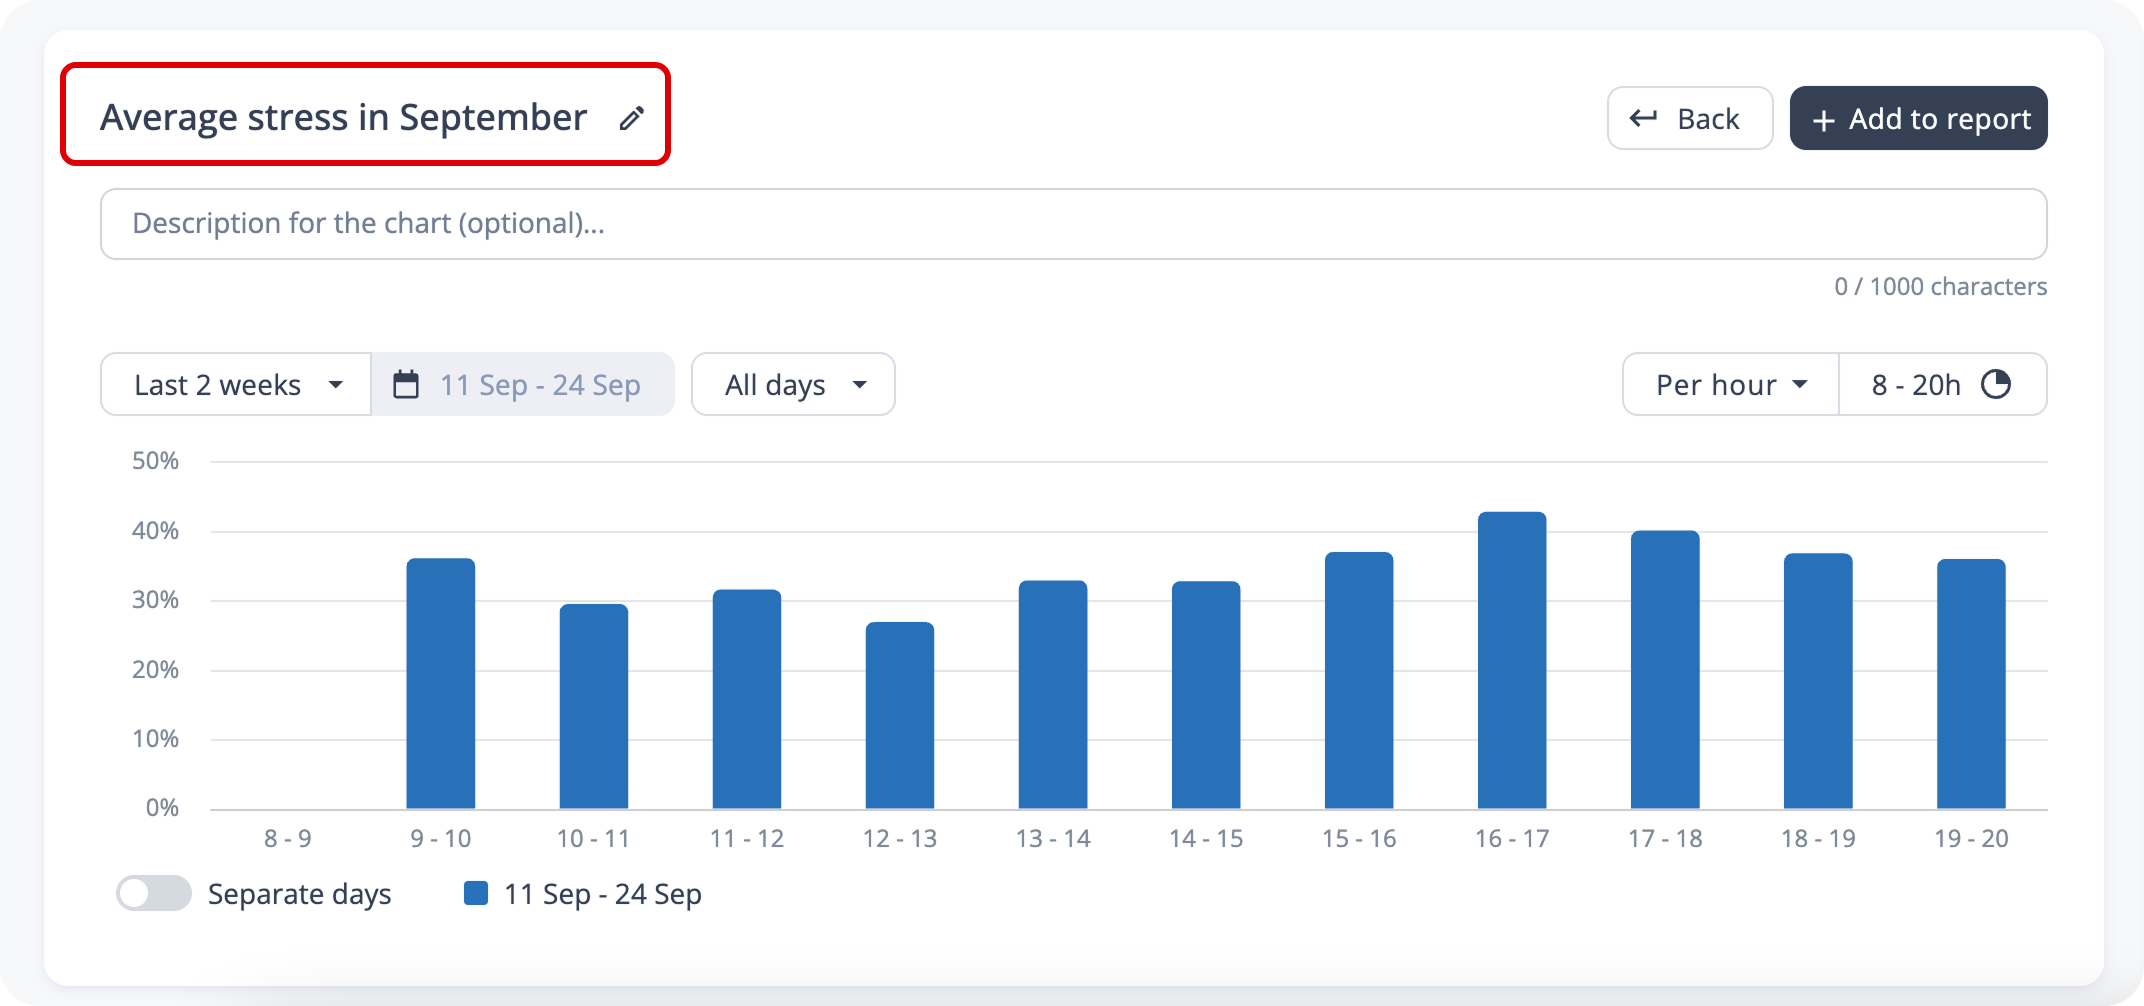 |
4. | Once you have done all the adjustments to the chart, click on “+ Add to report“ to save the chart. 👉 The chart should appear in the content bar on the right of the screen. .gif?inst-v=174e8e58-dac9-4992-879c-00705ffc81b9) |
Step 3: Edit or remove a chart (optional).
In the Content section on the right side of the screen, click on the row containing the chart you want to edit. The chart will open, allowing you to make your changes. .gif?inst-v=174e8e58-dac9-4992-879c-00705ffc81b9) | |
Click the dark blue “Save changes” button in the top-right corner to save your edits | |
3. | To delete a chart from the report, hover over its row in the Content section and click the cross (×) that appears on the right. .gif?inst-v=174e8e58-dac9-4992-879c-00705ffc81b9) |
Step 4: Rearrange charts (optional).
To rearrange the logical order of charts in the report, go to the content section. Click and hold on the row of the chart you want to move. Start moving it up or down and release it in the new location. .gif?inst-v=174e8e58-dac9-4992-879c-00705ffc81b9) |
Step 4: Download the PDF report
To download the report, go to the content section. Click on the dark blue button “Download”. 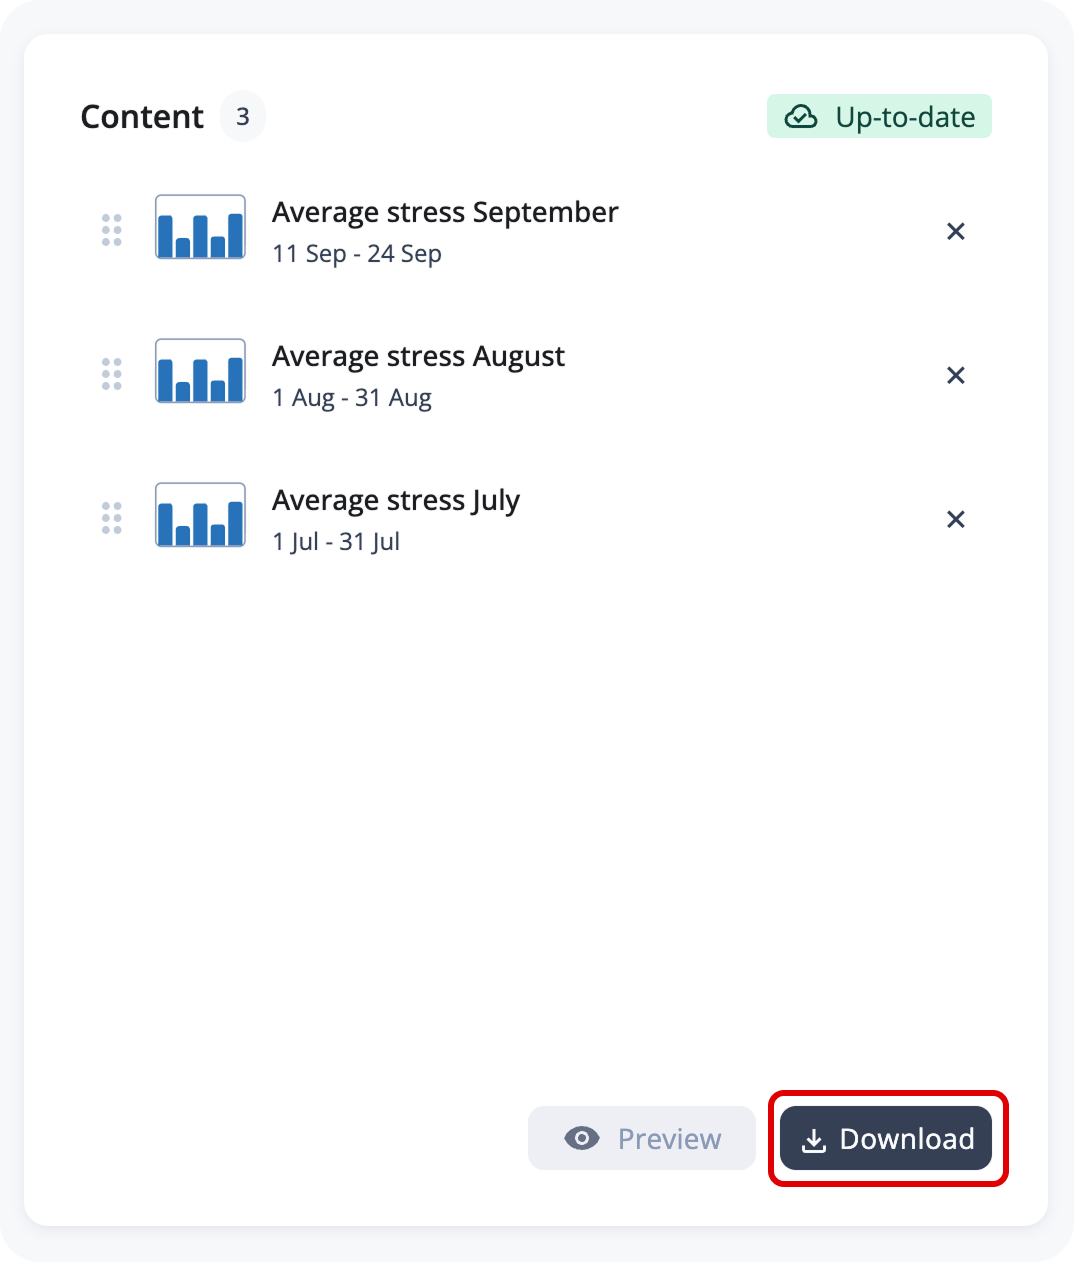 |